“The time of maximum pessimism is the best time to buy and the time of maximum optimism is the best time to sell.” -Sir John Templeton
Foster & Motley’s approach to stock selection is quantitative, systematic, and disciplined. But it is not dogmatic. By that we mean that our stock selection model is neither a purely “value” nor a purely “growth” stock approach, as it combines elements of each investing school of thought.
However, in our multi-factor quantitative stock model, the value factor tends to be the most important one driving the relative performance of our stocks over any period. Therefore, as the results of our approach have much more in common with the value style than the growth style, this commentary will take a deeper dive into explaining value investing.
Value investors seek to buy stocks at prices materially below their “intrinsic value”, or the present value of all the future cash flows. That is fine in theory but is impossible to directly measure as it requires knowledge of two things that can only be estimated rather than observed: the long-term growth rate of future cash flows, and the appropriate interest rate to discount these future values.
Because the elements of “intrinsic value” are so hard to pin down, most value investors use measurable substitutes as proxies to measure whether stocks are relatively cheap or expensive. Typically, these stand-ins are such “value” ratios as price to earnings (P/E), price to cash flow, price to revenue, price to book value, or price to dividends. Value investing as generally practiced means favoring stocks with relatively attractive (that is, lower) value ratios and leaning away from stocks with relatively higher value ratios.
Many academic studies have focused on measuring the usefulness of various valuation measures for stock selection. One of the more prominent ones1 found that on a market capitalization weighted basis over the last 67 years, the 20% of stocks with the lowest (cheapest) P/E ratios performed 4.4% per year better than the overall market while the 20% of stocks with the highest P/E ratios performed 1.9% per year worse than the market. This also holds true for various other long-time periods, for several other measures of “value”, for small stocks as well as large, for established international stocks, and for emerging international stocks.
But the catch (and of course, there is a catch!) is that the amount of extra return available from investing in value stocks is not consistent over short or even moderate time frames. Here are the historical odds of value stocks outperforming other stocks over various time frames2:
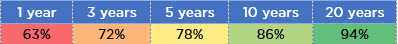
At first blush, this doesn’t look so bad: investing in value stocks tilts the odds in your favor over all time frames of a year and longer and it does so more consistently the longer the holding period. That’s a good thing. However, consider the reverse: the historical odds of value stocks underperforming other stocks:
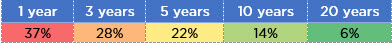
Viewed this way, it is a little scary: the historical odds of value stocks underperforming other stocks is definitely higher than we would prefer for periods of time most of us would consider to be relatively long. The historical odds that value stocks underperform in a random 5-year period are a bit more than 1 in 5. Worse, those odds have been 1 in 7 for 10-year periods, and were even as high as 1 in 17 for periods as long as 20 years.
What do we make of this? Should someone with a shorter expected investment time frame than 20 or 30 years not employ the value factor in their investment approach? Not at all! We need not deprive ourselves of the benefits of tilting the odds in our favor just because there is no guarantee, we just need to recognize that good odds are not the same as certainty.
There are three lessons here:
1) Holding stocks that are relatively cheap is a good way to tilt the odds of long term outperformance in your favor.
2) The consistency of that expected outperformance increases as your time frame extends.
3) Expectations should be tempered by knowledge that the value factor does not guarantee outperformance even for seemingly long time periods.
Those lessons are most useful to recall during longer periods of underperformance for value stocks. Since value stocks (as measured by the Russell 3000 Value Index) have underperformed the market (as measured by the Russell 3000 Index) in a cumulative basis for both the prior 10 and 15 years through 2017 (and, for 7 of the past 10 individual years) this seems to qualify as an excellent time to remind ourselves of this.
Employing the discipline to avoid expensive stocks and the patience to continue to do so through what can be long periods of disappointment has historically been the best way to improve your odds of investment success. Knowledge of how to tilt investment odds in our favor is necessary but not sufficient – to make it work, you have to stick with it.
Sources:
1. 1951 through mid-May, 2018, value measured as price to trailing 12 month earnings.
2. 1927-2017, value measured as price to book value.