At any point in time, it is always well known that certain companies (and industries) are prospering. Stocks in those companies (and industries) are popular so their prices get bid up. Human nature being what it is, people in aggregate project recent trends to continue and they typically bid prices of popular investments beyond the premium they deserve. Likewise, at each point, some companies (and industries) will be struggling and these investments will be unpopular. The market assumes these investments are riskier, so more seek to sell than buy, and their prices are pushed down. On average, they tend to get pushed down more than they deserve. Because of this tendency of the market to over-react, popular stocks (known as Growth stocks) are generally expensive and, in the long run, tend to underperform the unpopular, cheaper stocks (Value stocks).
Many academic studies measure the impact of this, but the longest and perhaps best known is by Ken French of Dartmouth who keeps the data updated and available. Dividing the market at each point in time into Value (cheap) and Growth (expensive) on the simplistic measure of market price to accounting book value, from 1927 through 2019, Value stocks outperformed Growth stocks by 3.5% per year (stated differently, Value stocks outperformed the market by approximately half of that difference). This additional return over time, however, is not “free” as it comes at a cost measured in discomfort from underperforming frequently. In fact, on a single year by year basis, Value only outperformed about 60% of the time, meaning that it underperformed 40% of the time. Its frequency of outperformance improves as the holding period lengthens: Value performed better in 75% of the rolling 5-year periods, in 89% of the rolling 10-year periods, and in 95% of the rolling 15-year periods. Unfortunately, that means historically, Value underperformed in one out of four 5-year periods, in 11% of 10-year periods, and in 5% of all 15-year periods. But the historical odds of Value outperforming in the 10-year period after underperforming in the previous 5- or 10-year periods were much better than average. There have been 13 measured 5-year periods in which Value underperformed and for which we have a full 10 years of subsequent data, and in these subsequent 10-year periods, 12 of the 13 saw Value outperforming with the average outperformance being 6.5% per year, nearly twice as good as the typical 10-year experience. In a very small sample, we now have three 10-year periods of value underperformance for which we have 10 years of subsequent data, and in each of those Value outperformed subsequently and did so by a wide average of 10% per year (with the worst being outperformance by 7% per year).
Coming into this year, Value had underperformed Growth over the prior 5-, 10-, and 15-year periods, so all known market history implied that the odds of Value outperforming over the next 10-year period were enhanced. Of course, that implied very little about the subsequent 1-year period, and in fact, that trend accelerated this year so far:
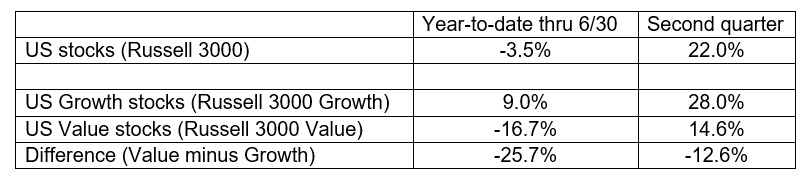
This year to date, Value has underperformed Growth by an astonishing 25.7% (here using the Russell 3000 indices). Historically, a gap of that size for a full year has only been exceeded once (31.8% in 1999) and approached one other time (25.1% in 1980). It turns out that this year also has another important similarity with both the years 1980 and 1999 as well.
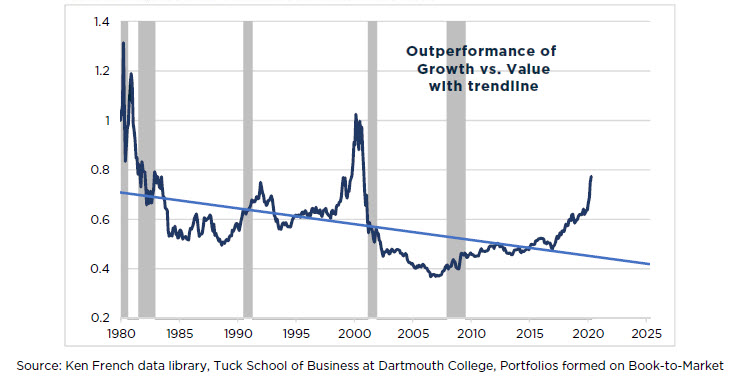
Below is a graph of the long-term performance of Growth vs Value from 1980. Note that this line rises when Growth outperforms (that is, when Value underperforms). The trendline is down because Growth underperforms Value over time. Notice the strong upward deviation from the downward trendline now as well as in 1999 and in 1980.
Now consider the next graph, which is obviously highly correlated, but which measures something else entirely – market concentration. This series shows what percent of the market capitalization of the S&P 500 is accounted for by the largest 5 companies in the index at each point in time (5 being purely arbitrary, the same story holds true for the top 3 or the top 10 or 20 companies). This is one way to measure concentration in the market as it varies over time, and you can see that the largest 5 companies in the index accounted for 19% of the S&P 500 in 1999, for nearly 19% in 1980, and the largest 5 companies account for 20% now, whereas at other times the largest 5 companies accounted for as little as 11% or less of the index.
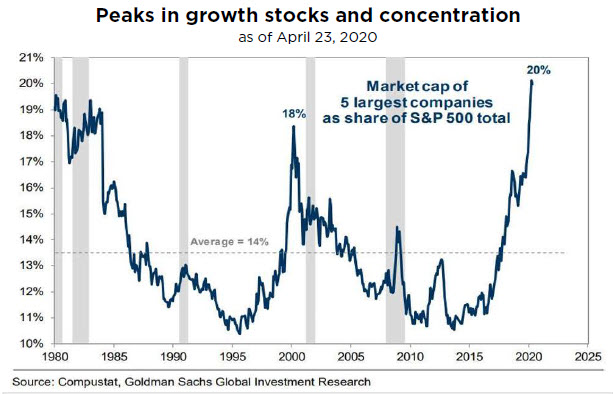
Over time, the degree to which much of the market was concentrated in just a few companies varied, but prior peaks in market concentration coincided with peaks in Growth’s outperformance and with bottoms in Value’s underperformance.
In summary, cheap, unpopular stocks have outperformed expensive, popular stocks over time, but have sometimes lagged for extended periods. Overall stock valuations at the beginning of this current crisis were quite expensive and through the crisis overall market valuation and market concentration have each just gotten more extended. However, amid exceptionally high levels of uncertainty, very low interest rates, and expensive stocks in the aggregate, there is one exceptional opportunity: The extreme divergence in the performance of Growth and Value stocks has produced a generational opportunity within Value stocks and the current degree of market concentration identifies a level of extremity that in the past marked a long lasting turn in the performance in Value over Growth.
Time will obviously tell, and the present may prove to be the historical exception. But from several different perspectives we can assert that while the stock market’s long-term return expectations from this point look quite unappealing, expectations for the relative returns of Value stocks have seldom looked better.