Investor uncertainty and stock market volatility defined the 4th quarter of 2018, as we experienced the first significant pullback in US stocks in nearly a decade. Not every year yields positive stock market returns, and at times, an entire year’s return can be reversed in a matter of months.
Yet, volatility is both a natural and necessary fact of investing in stocks. The adage, “no risk, no reward” still holds true as we put the 4th quarter in our rearview mirror.
Volatility is defined as how much variation there is in the price of a given stock or index of stocks; simply put, how widely a price can swing up or down. It is generally considered to be a measure of the level of risk in an investment. Typically, low volatility is associated with positive market returns and high volatility with negative market returns. However, volatility can be high when stocks are increasing or decreasing in value. It does not tend to be a focus in the news in a good market for obvious reasons.
We perceive the unpredictability of stock markets more acutely when volatility is higher than in previous periods. What better recent example of that than 2018! As you can see in the chart below, the previous year, 2017, was the first year in thirty years where there were no negative months in global stocks, as measured by the MSCI All World Stock Index (ACWI).
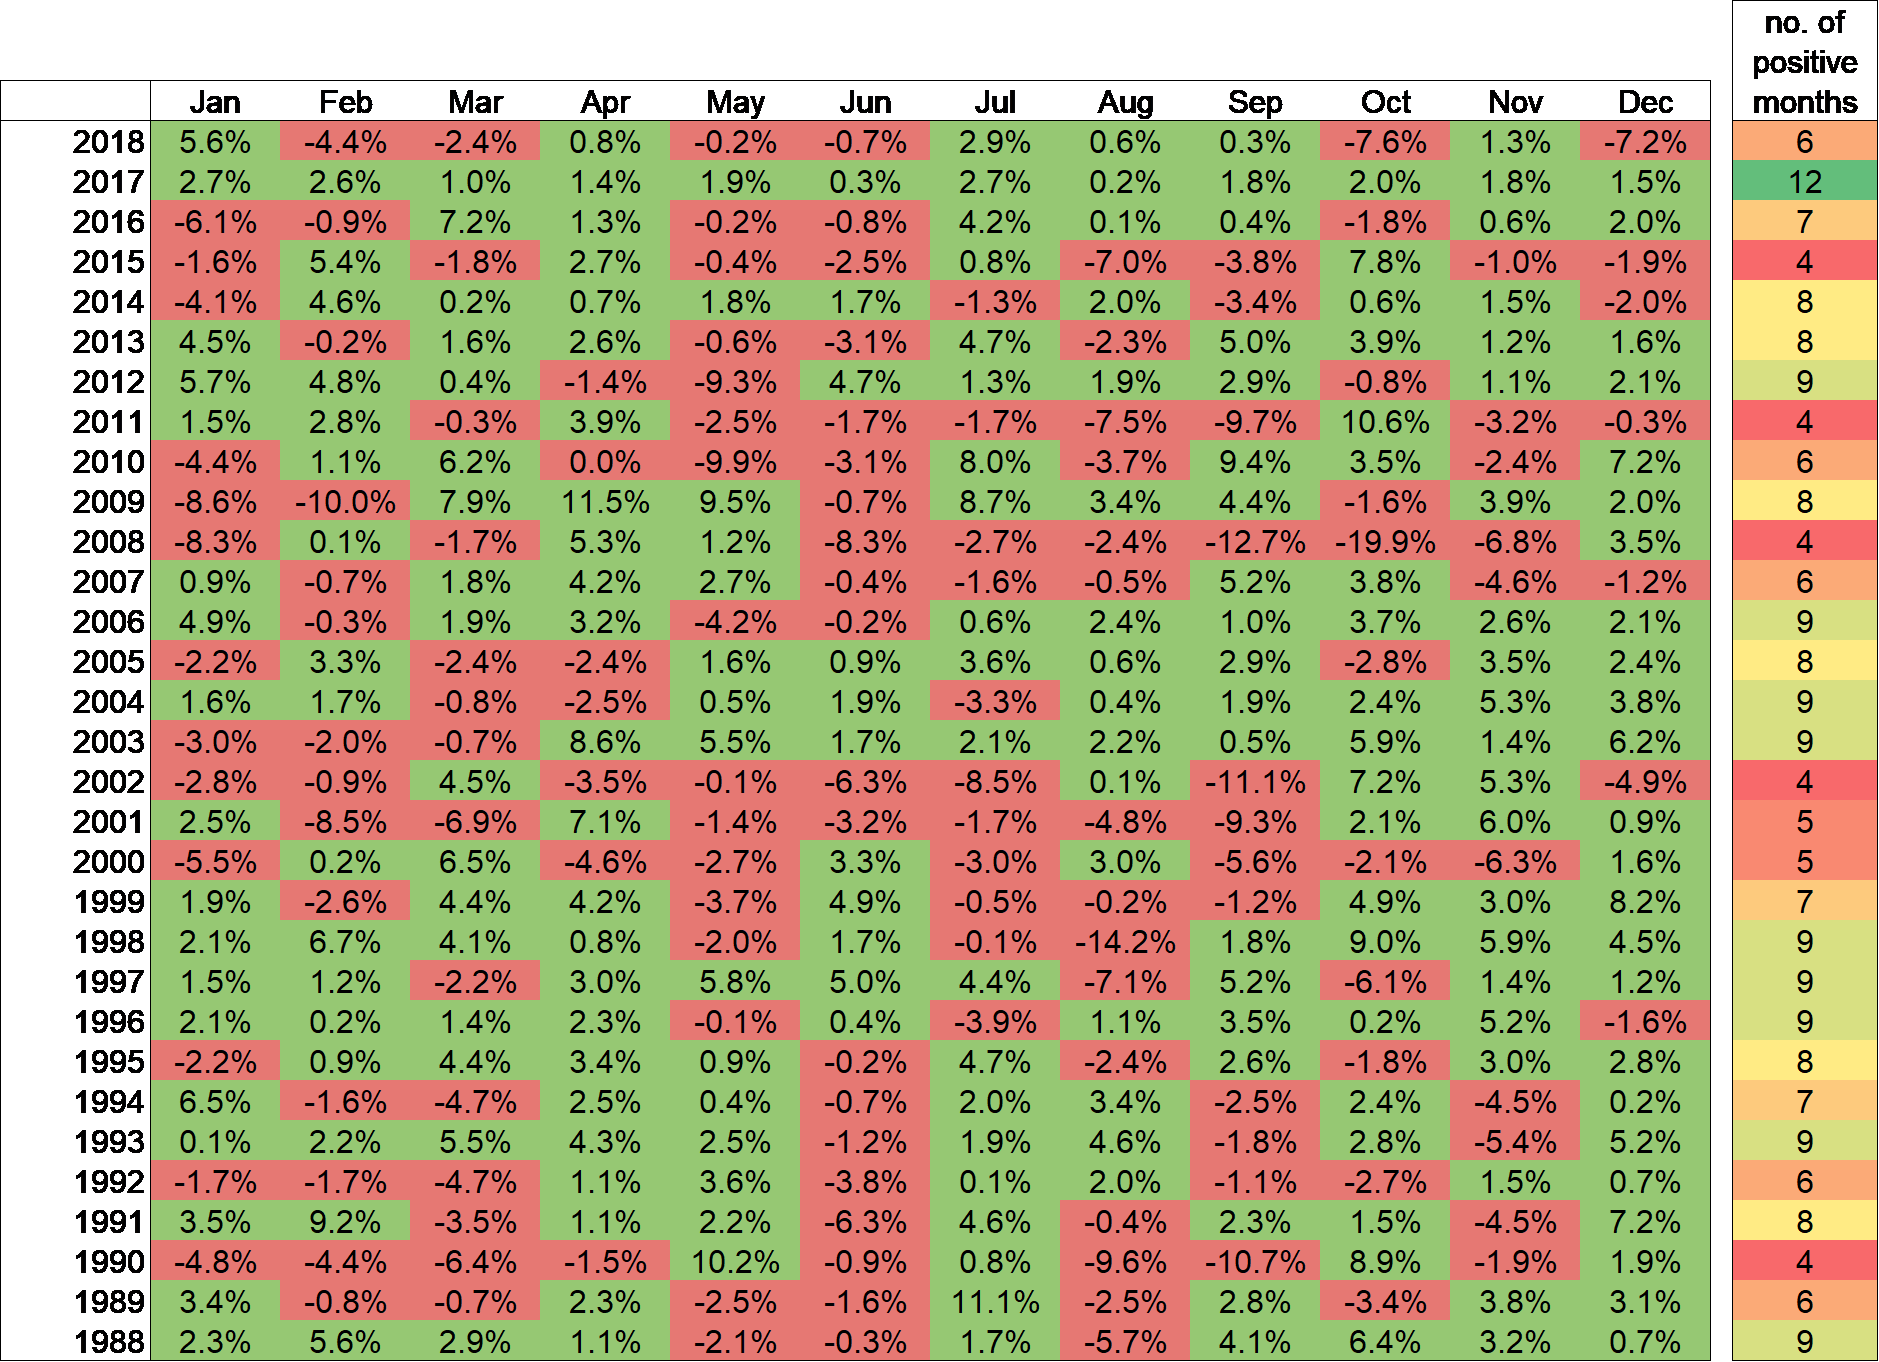
Investors can be lulled into complacency about stock market risk in such low volatility environments. 2018’s market movement felt more extreme than it otherwise would have, because it followed on the heels of the extraordinarily placid 2017 market. How might we put that into perspective and understand when volatility is above normal levels?
Standard deviation is a quantitative measure that can serve as a proxy for volatility. The higher the standard deviation, the higher the variability in market returns. The graph below shows historical standard deviation of annualized monthly returns of large US company stocks, as measured by the S&P 500. Volatility averages around 15%, is often within a range of 10-20%, and rises and falls over time. More recently, volatility has risen off historical lows, but has not spiked outside of the normal range.
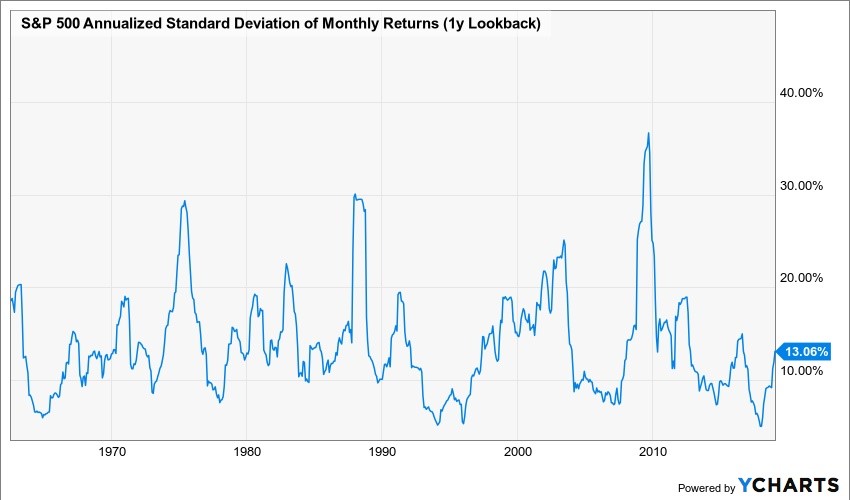
Can we extrapolate these movements or draw conclusions about the future? Perhaps. What we do know is that extreme events tend to be mean-reverting. In other words, when volatility is at historical lows, we can expect it to rise at some point towards the long-term average. The inverse is also true; when volatility is well above average, we can expect it to fall in the future.
Volatility is a normal characteristic of investing in stocks. The reward is that over time, stocks have delivered a higher average return than most other asset classes. Recognizing this tradeoff helps us stay the course when stock prices are fluctuating.