July, another month of pandemic is now behind us. As you know, we are experiencing three crises at once: the Covid-19 health crisis, the economic crisis stemming from pandemic-related shutdowns, and a market crisis. While market volatility remains above normal, the intense volatility and the bear market of late-February through early-April may be over now, but extreme uncertainties remain.
New cases of the virus surged in March, concentrated in New York and the Northeast, peaking in early April. New cases then slowly declined into late-May and early-June. After that, a second surge arrived, this time concentrated in the South and California. In the past couple of weeks, that surge has also flattened and may be rolling over – we’ll see since cases in the Mid-west have more recently been picking up.
The peak in the 7-day average of new cases identified per day in the second wave was approximately double that of the first wave peak. But testing approximately quadrupled between the first and second peaks. Additionally, the 7-day average of percent of tests that were positive topped out over 20% in the first wave and appears to have peaked at just over 9% in mid-July. And 7-day average deaths so far in the second wave have remained at less than half of the April peak.
The point of this detail is that the health crisis continues, and the second wave may appear to be worse than the first wave per the new case data alone. But it may not be nearly so severe since the new cases identified are a function of testing and that has not been comparable during the two episodes. What appears to have been deterioration may have been improvement masked by vastly different testing experiences.
Perhaps more important is progress toward vaccines and we’re aware of no discouraging news July brought on that front. Over 100 are in breakneck pace development worldwide. Administration officials raised the expectation of a viable vaccine by December or January. Pfizer recently indicated their timeline may be November for first deliveries. The BBC reported Saturday that Russia expects regulatory approval of their vaccine this month and to begin mass administration in October. There remains a possibility that none of these efforts succeed, but each week that passes without a material setback makes it more likely that an effective vaccine will begin to be available here within a few months, though manufacturing enough doses and administering them to the whole country will obviously take considerably more time than that.
Last week the advance estimate for second quarter GDP indicated the economy shrank a little over 8% in the quarter ending 6/30 (-32.9% annualized is the number most reported), a bit less bad than expected. But that is all backward-looking. Data on employment recovery in June and July was exceptionally strong (from a very low base). Retail sales rose last month more than expected and housing is strong. But “high-frequency” data indicates a likelihood of a stalling in the recovery more recently. And impacting all this is support from the Fed and from Congress, the latter being uncertain.
Markets have generally bounced strongly since the 3/23 bottom and the S&P 500 added 5.5% in July. Forward-looking markets are clearly anticipating economic recovery, presumably including widespread availability of a reasonably effective vaccine in an expeditious time frame. Given stocks’ generally stretched valuations, there is certainly room for market setbacks should the economic recovery fail to continue, or a vaccine not arrive as expected.
In our last update (“Embracing Value”), we focused on the stock market’s extreme concentration in a few large, expensive companies and the concurrent extreme disparity in performance of Value stocks versus other stocks. This time, we’ll expand that to a review of disparity of performance between larger and smaller stocks.
This year to date, there is a nearly perfect correspondence between not just valuation and return, but also between valuation, company size, and return. This year, the cheaper the company and the smaller the company, the worse return it is likely to have experienced. Company size is generally referred to as “market cap” – the market’s “capitalization” of a company, meaning the value of the aggregate of all the company’s outstanding shares times the current stock price.
Smaller companies are historically more volatile than larger companies, so investors demand and in the long run have received a higher return than the market (referred to as a “premium”) for investing in such riskier investments. From 1926 through 2019, the smallest 30% of US companies outperformed the largest 30% by 2.2% per year (in our last update, we noted that over the same period, the cheapest stocks outperformed the most expensive stocks by 6.6% per year; source for each is the Ken French Dartmouth data).
But this year has reversed the long-term trend to a significant degree. Here is a table breaking down just the S&P 500 companies by size and value this year through 7/3:
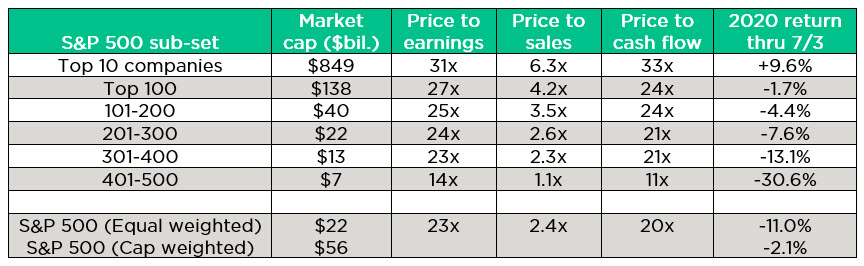
2020 has been an extremely unusual year in many ways. In addition to the pandemic, recession, bear market, and civil unrest, this year has also brought extremely unusual performance disparity between cheap stocks and expensive stocks as well as between smaller stocks and larger stocks.
In “Embracing Value”, we identified value stocks as currently representing an unusual relative return opportunity. For simplicity, we left out the dimension of company size in that last commentary but from this information you can see that the exceptional opportunity is today not simply in cheap stocks versus expensive stocks, but in smaller, cheap stocks versus larger expensive stocks. And as we referenced before, that opportunity has seldom looked more appealing.