“So foul and fair a day I have not seen”
Macbeth Act I, Scene 3
Welcome to 2026! To get our bearings, we look back at the year that has passed, and 2025 was a great year for markets broadly. The Russell 3000 Index of US stocks returned 17.16%. That was a little short of a third 20%+ year in a row, but with a weak dollar and stronger international stocks, our global stock index returned over 21% in 2025 and our managed global stocks compared well with that. Inflation hedge holdings and market risk hedges each performed exceptionally well. Bond indexes returned both more than their blended coupon interest rates and about as much as we expect from stocks in an “average” year. The one weaker spot in portfolios, which was not terrible, was real estate coming in with low single-digit, yet positive, returns.
Yet, the US economy is a mixed bag. Recently reported third quarter GDP growth of 4.3% above inflation was a strong surprise. On the other hand, employment growth has been weak, and the overall unemployment rate in November at 4.6% was its worst since 2021.
Inflation and monetary conditions are similarly mixed. The Core Personal Consumption Expenditures Price index, which is the Federal Reserve’s favorite inflation measure, rose 2.9% in the third quarter, up from 2.6% in the second quarter. That’s both rising and above the Fed’s 2% target. Yet in December, the Fed cut interest rates and announced a new round of monetary easing.
Perhaps there is meaning in these apparent contradictions. Strong economic growth coupled with weak employment growth could imply anticipation of AI productivity gains is depressing demand for workers even amid growth (which is in fact occurring per some accounts). As to the Fed, while its stated inflation target is 2%, Fed actions imply that something higher than 2%, and perhaps as much as 3%, is the Fed’s new, though unexpressed, inflation target. Combined, those seeming paradoxes could portend an extended period of pesky inflation, elevated profit margins, continued economic growth, and yet persistently weaker employment growth. Copper prices were up 39% last year, so we also note that “Dr. Copper” seems to agree with an expectation for continued economic strength coupled with elevated inflation. We don’t know if that will occur, but those fundamental conditions would not be bad for stocks.
The other side of the positive view for stocks remains valuations. The inimitable Warren Buffett just retired, so we’ll dust off his “Buffett Indicator” of general stock market valuations in homage: the ratio of total US stock market value to GDP. In 2001, Buffett said when that ratio “approaches 200% - as it did in 1999, and in part of 2000 – you are playing with fire.” Today, that measure at 230% looms even higher (and, reflecting his convictions, Buffett left Berkshire holding as much in T-bills as in stocks). That and a range of other valuation measures combine with unusually high stock market concentration in a few popular holdings to indicate a likelihood of generally below-average stock returns for some time ahead.
We speak of this often, but something else that is high relative to GDP is the federal debt, currently sitting at 124% of estimated GDP. For context, that measure peaked near 120% at the end of WWII, averaged under 70% from the 1960s through 2012, and peaked again at 125% in 2020 with COVID disruptions. Very high levels of federal debt to GDP can be ignored for a time, possibly, for quite some time, but must eventually be addressed, most likely through currency debasement via higher inflation (since the other options of either default or federal fiscal prudence each appear far less likely).
It may also seem we’re referencing inflation a lot. That would be because we are. The reference in this paragraph is the 11th so far. That’s partly because it’s currently the top-of-mind economic concern for the country, referred to now by the political classes as “affordability.” Not all, but much of that concern centers on housing affordability, which sits at the intersection of home prices, mortgage interest rates, and household income levels. You have likely heard much talk about affordability (and with the mid-term elections, you’ll likely hear much more this Fall), but you may not have seen the data. Here it is (from Bankrate.com through 2024, and estimated by Google’s AI for 2025):
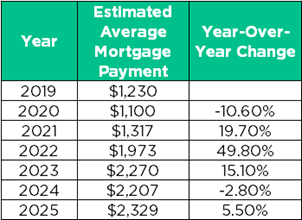
This makes it clear that the post-COVID period of 2021-2023 was an extremely bad period for home affordability, and that it improved a bit in 2024. But it turned up again last year and hit a new peak, so it remains a near-term concern. Moreover, if we add about $300/month for average property taxes, and another $200/month for homeowner’s insurance, this implies the average cost of a house exceeds $2,800 per month, or nearly $34K per year. Mortgage lending guidelines used to call for housing costs to not exceed 25% of gross household income, but that has lately been relaxed to 28% of pre-tax income or more. That implies household income approaching $121K per year is needed to afford an average house. With median household income in the mid-$80,000s, that’s a problem which manifests in many ways, including that the average age of the first-time homebuyer hit 40 last year, up from 31 just ten years ago. As home ownership has always been a key element in the American Dream, lack of attainability for many just increases the gap between the haves and the have-nots.
With homes priced out of reach for so many, one would think demand for homes would be low and supply high. Not so: the US inventory of existing homes for sale is on the low side of the historical range over the past 25 years. While this may bode well for homebuilders, an even stronger bet may be on looser lending standards, lower down payment requirements, and the advent of 50-year mortgages which imply that while a mortgage crisis may not be at hand, its seeds are perhaps being planted today.
Market strategists obsess about whether the AI boom will continue apace given numerous challenges and circular financing among the top incumbents, and when its valuation bubble may pop. But here’s a much nearer-term potential problem that, while well-known, seems to have all but disappeared from worry lists: The US Supreme Court is expected to hand down a ruling on the Constitutionality of last year’s tariffs in weeks or even days. Most legal opinion on the law by which the administrative exception was made as well as the comments of justices during oral arguments indicate they might be overturned. We are uncertain of the amount involved so far but estimates range in the hundreds of billions of dollars in taxes already collected. It may seem now like a distant memory, but markets didn’t take kindly to the tariff impositions last Spring, as the S&P 500 Index fell nearly 19% in 48 days from mid-February through early April. We don’t know how markets may respond to tariffs being overturned by the Court, but we should mentally prepare for a reaction that may be just as sharp, ugly, and hopefully as brief.
Geopolitical surprises have been more frequent and now comes Venezuela. The largest potential near-term market impact could come in a strong reaction from China which has greatly increased its footprint in the region recently (and restricting rare earth minerals exports to the US seems to be its go-to move). We’ll see.
2026 is a mid-term election year, and that year in the 4-year presidential cycle has historically included the largest corrections of the four, averaging -17.5%. Moreover, while historically, stocks have risen on average seven or eight individual years out of ten, after three up years in a row, the odds of that being followed by another up year have historically dropped to only one out of two. That’s not bad, it’s just far worse than usual.
International stocks and small stocks continue to look relatively compelling while mega-cap US stocks and long-term bonds appear to embody the most potential risk now.
So, welcome to 2026! We very much hope it’s a dull ride, but we recognize it may be an “interesting” one as we diligently work within tax constraints to squeeze out unnecessary portfolio risk and improve portfolios’ resilience in multiple ways.